The MyFunRun System
Dashboard
The MyFunRun "Dashboard" is where you can monitor and manage your Fun Run fundraising campaign.
Quick Links
- Home: Your campaign at a glance
View key statistics and totals in real time. - Offline Funds (Collected by Participants)
Total amount of all offline donations (cash and/or checks) which have been verified as "collected". - Reports All reports work in a similar fashion and feature the following options:
- Resources The Resources tab is where you can access all your customized campaign materials in one place.
- Help Center Anything and everything needed for a successful fundraising campaign.
General Statistics Report
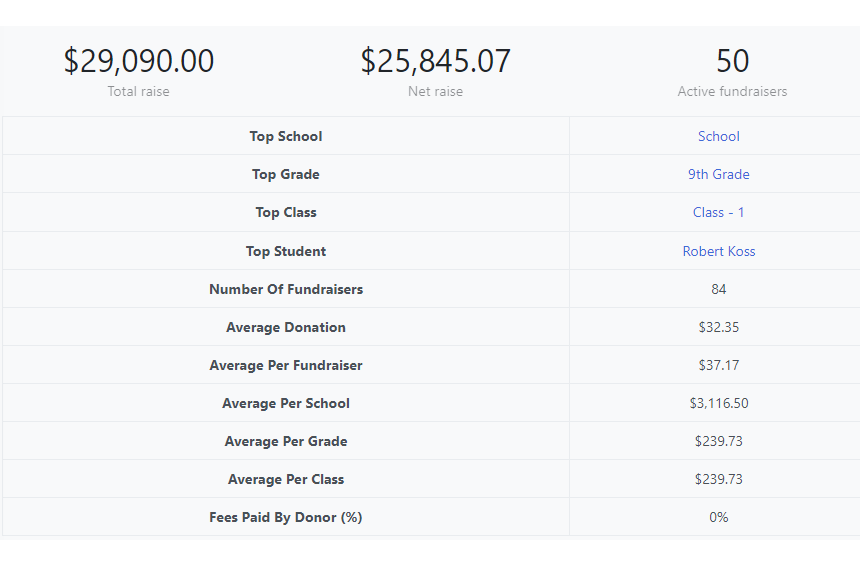
When you log into your Dashboard, you will land on the Home tab where you will see the "General Statistics" report. It displays key statistics and metrics at a glance to help you manage your fundraising campaign.
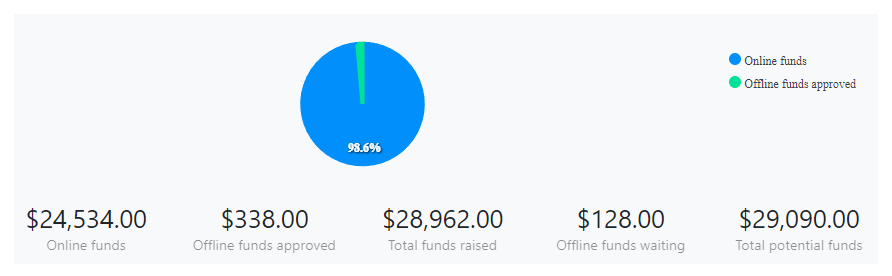
All Feature Totals
This is where you can compare how much was raised online versus offline.
-
Online Funds (Raised by Participants)
Total amount of all donations made to the campaign. -
Offline Funds (Collected by Participants)
Total amount of all offline donations (cash and/or checks) which have been verified as "collected". - Total Funds Raised (Raised by Participants)
The combined total of all online funds and all offline "collected" funds. -
The combined total of all online funds and all offline "collected" funds.
Funds that have been entered into the system as potential income, but have not yet been collected. -
Total Funds Potential
Total Funds Raised + Offline Funds (waiting for approval).
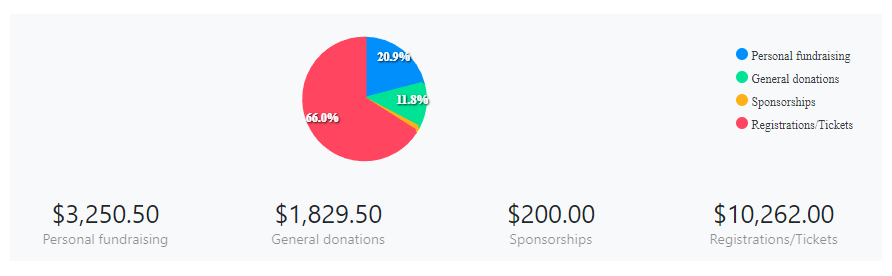
Total Per Feature
Displays the cumulative totals for each feature.
-
Personal Fundraising
Total amount of donations made through the Personal Participant Pages. -
General Donations
Total amount of donations made through the General Donations feature. -
Sponsorships
Total amount of donations made through the Become a Sponsor feature. -
Registrations/Tickets
Total amount collected through the purchase of Registrations/Tickets.
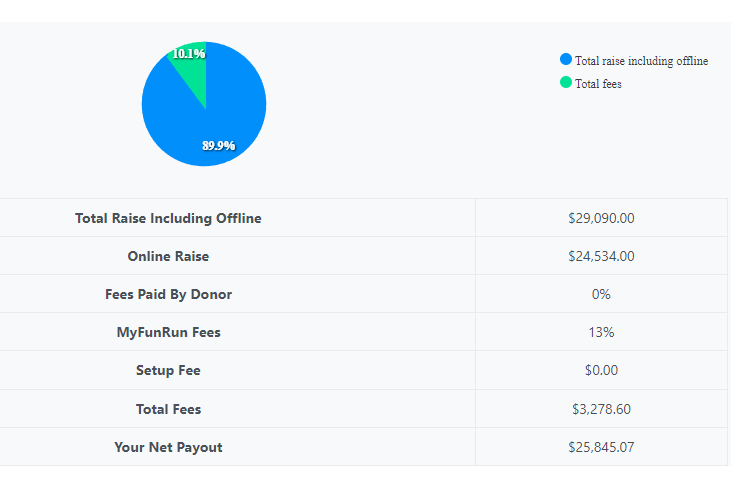
MyFunRun Payout Information
Displays the details of totals, fees and payout.
-
Total Raise (including offline)
Total amount of all approved funds raised. -
Online Raise
Total amount of all funds raised online only. -
MyFunRun Fees
Online Raise - MyFunRun Fees percentage. -
Setup Fee
Setup Fee according to the initial contract. -
Total MyFunRun Fees
MyFunRun Fees + Setup Fee. -
Your Net Payout
The actual amount that MyFunRun will pay you out.
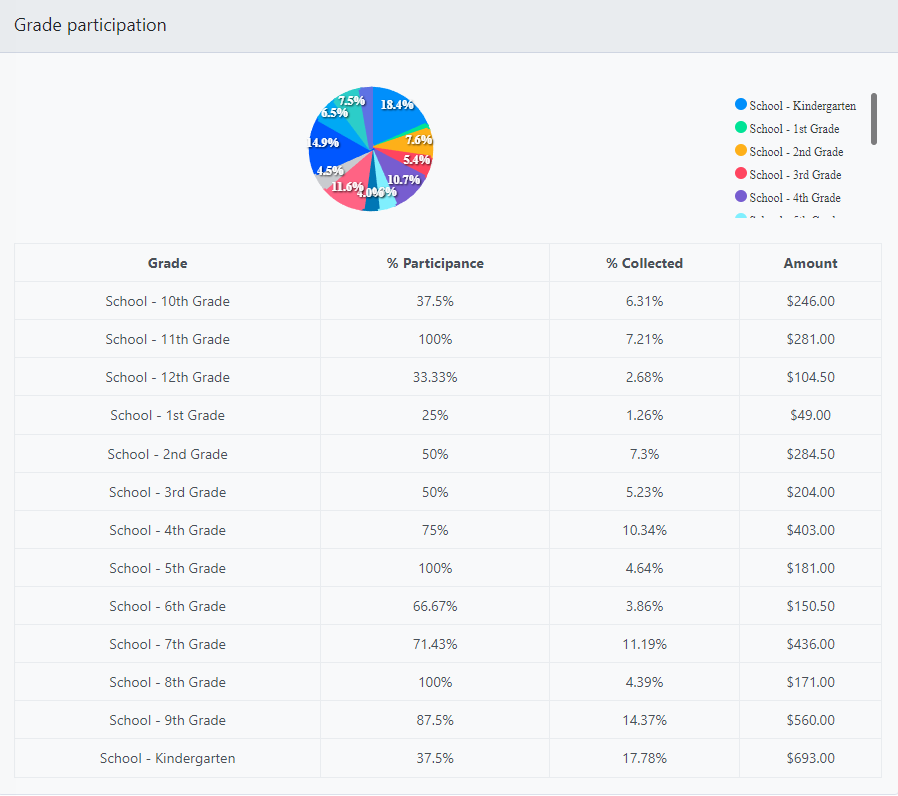
Grade and Class Participation
Displays the details of totals, fees and payout.
-
% Participance
Percentage of participants who actively participated in the fundraising. -
% Collected
Percentage of raised funds based on the set goal amount. -
$ Amount
The collected funds.
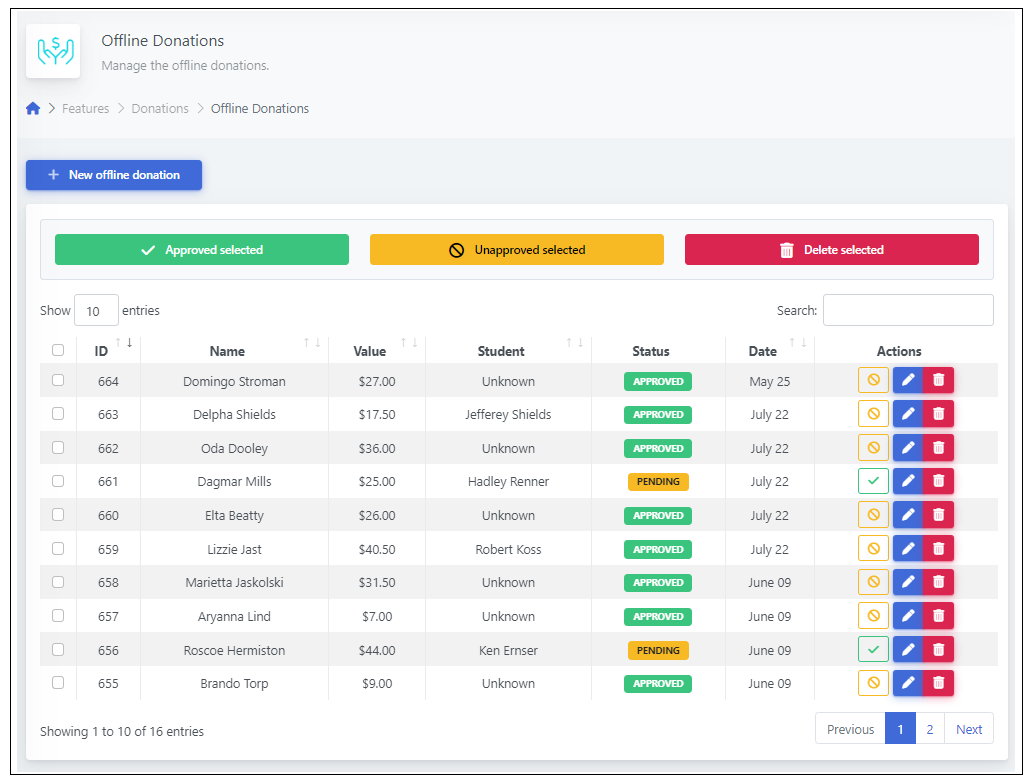
Offline Donations
Managing cash and checks
MyFunRun provides an integrated system to manage your offline cash or check donations.
Participants like to see their offline donations reflected on the website right away. Therefore, when a student or parent enters an offline donation it will immediately update the totals, goals, and leaderboard on the website. At this point however, the cash or check donation has not yet been collected and verified by the school. Therefore the Participant Donations Report displays 2 separate amount columns. One displays the amount that has been verified (collected), and another column displays the amount "pending" (to be verified). This prevents "over rewarding". If you prefer the website totals, goals and leaderboard only reflect donations which have been verified, ask your MyFunRun representative to change your account setting.
Participants like to see their offline donations reflected on the website right away. Therefore, when a student or parent enters an offline donation it will immediately update the totals, goals, and leaderboard on the website. At this point however, the cash or check donation has not yet been collected and verified by the school. Therefore the Participant Donations Report displays 2 separate amount columns. One displays the amount that has been verified (collected), and another column displays the amount "pending" (to be verified). This prevents "over rewarding". If you prefer the website totals, goals and leaderboard only reflect donations which have been verified, ask your MyFunRun representative to change your account setting.
-
Adding an Offline Donation:
Click on the Reports tab > Participant Donations. Under the graphs, on the right side, find the Add Offline Donation button.
Add donor's name and amount. -
Deleting an Offline donation:
Click on the Reports tab > Participant Donations. To easily find your offline donation, filter donations to display Offline Only.
Once the donation is found, click on Verified or Pending then Delete. -
Editing Offline Donation:
Click on the Reports tab > Participant Donations To easily find your offline donation, filter donations to display Offline Only.
Once the donation is found, click on Edit and change all the desired information.
*IMPORTANT: For security reasons, we do not allow to change the donation amount. If the amount is incorrect, please delete this entry and add a new one. -
Verifying offline donations in your Dashboard:
Click on the Reports tab > Participant Donations To easily find your offline donation, filter donations to display Offline Only.
Once the donation is found, click on Pending then Approve.
Reports
All reports work in a similar fashion and feature the following options:
-
Download:
Click on the Excel icon to download the full report in a spreadsheet. -
Filter:
Use the filter option to view a sub-set of the entire report. -
Search:
Use the search to find data regarding a specific participant or sponsor. -
Entries by page:
Select the number of rows to view on one page at a time. -
Sorting:
Click on the column title to sort by column. Click the arrow next to the column title to reverse sort the column.
Total Per Student Report
This report gives you access to the totals of all transactions including online and offline, and can filtered and sorted in a variety of ways.
-
Date/Time
You can see how much each student has raised within a limited amount of time. Select the From date and the To date, then click Search. -
Show All Transactions
This link resets the Date/Time settings to include the total time frame. -
Total Collected Column
Displays the Total Potential amount raised by the student during the total time frame. This column does not depend on the selected period.
Total Collected = Online + Offline Verified + Offline Pending -
Collected in Period
Displayed only when a timeframe is selected.
Collected in Period = Online + Offline Verified. *Does not contain Offline Pending. -
Online
Total of all the online donations. -
Offline Verified
Total of all the offline donations that have been approved. -
Offline Pending
Total of all the offline donations that are waiting for approval. -
Number of Transactions
Number of donations a participant has received.
Participant Report
The participant report allows you to view details regarding each participant.
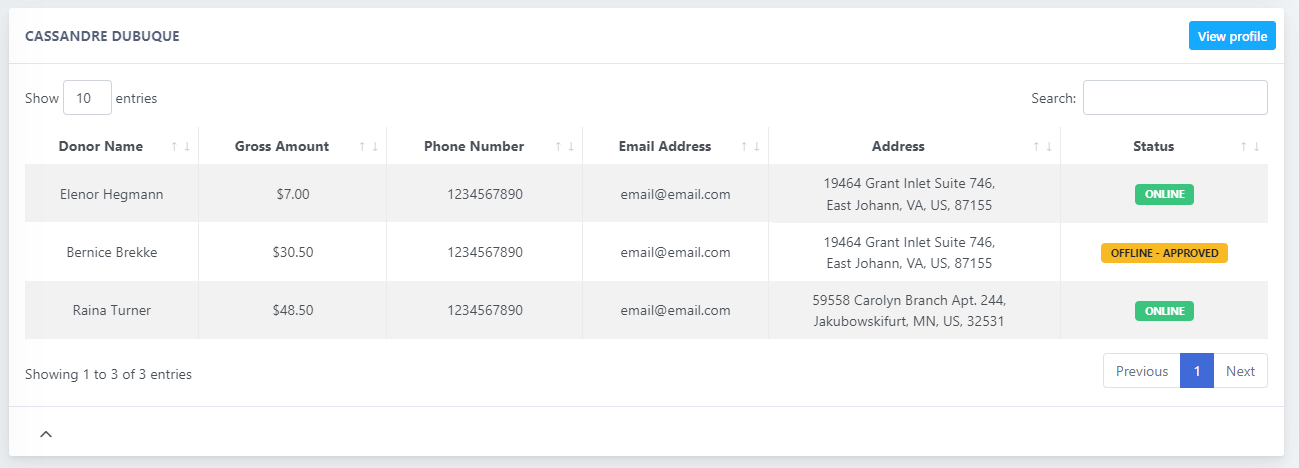
Thank You List
In this report, you can find each participant with their list of donors and their contact information.
Using the Thank You List, sending Thank You emails will be much easier!
Using the Thank You List, sending Thank You emails will be much easier!
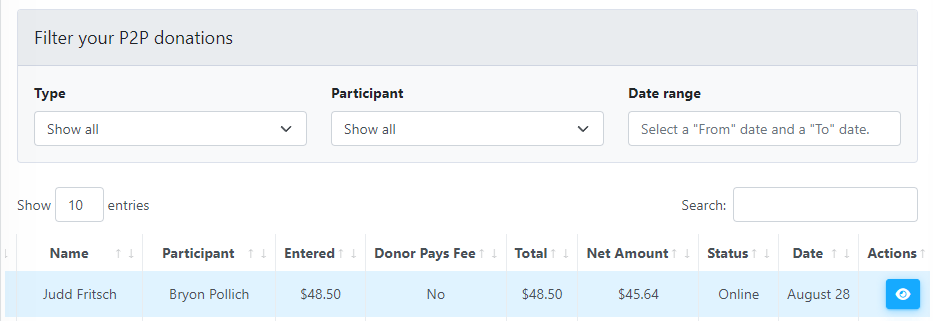
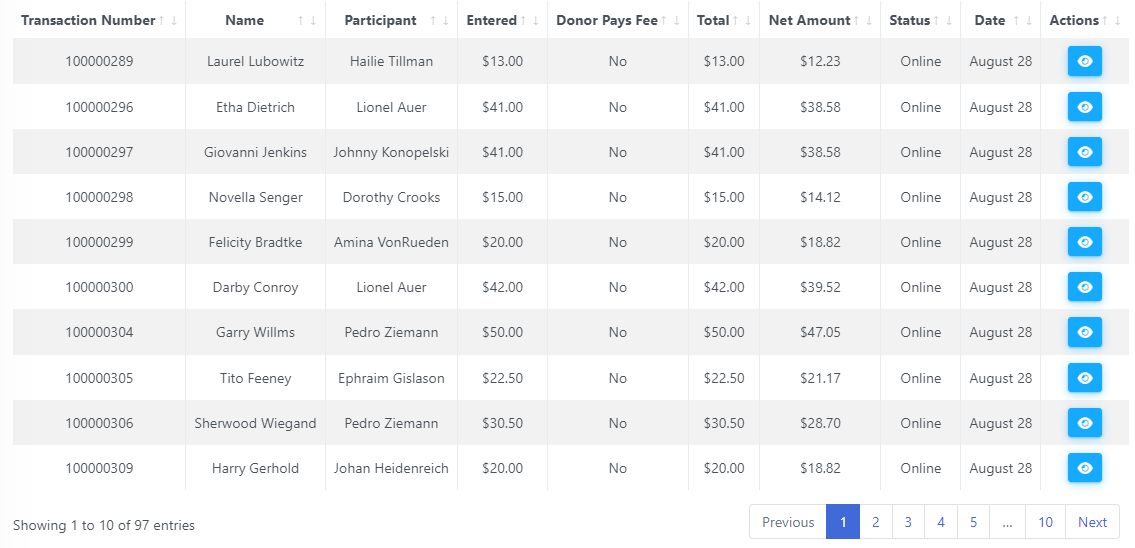
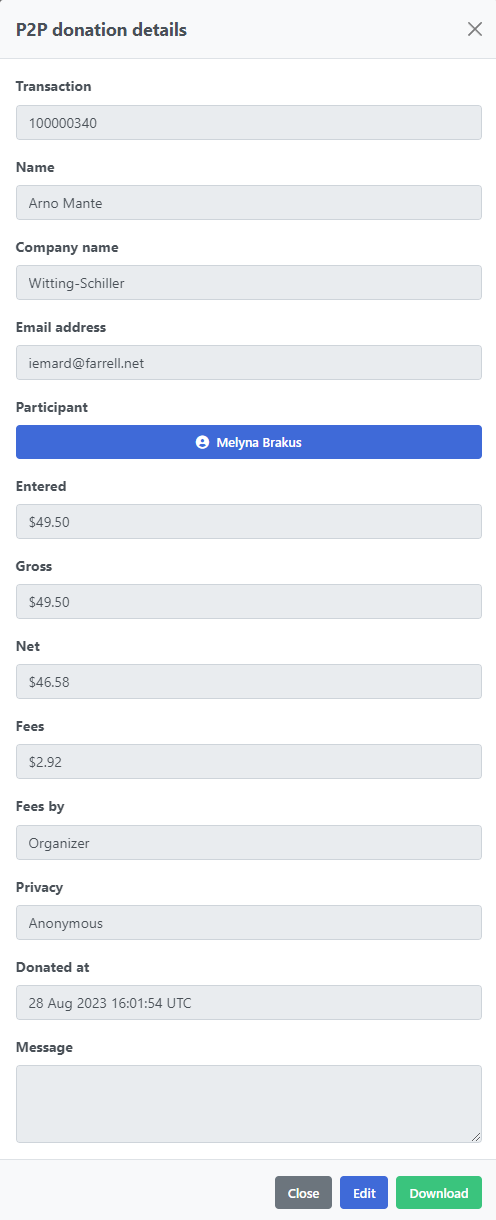
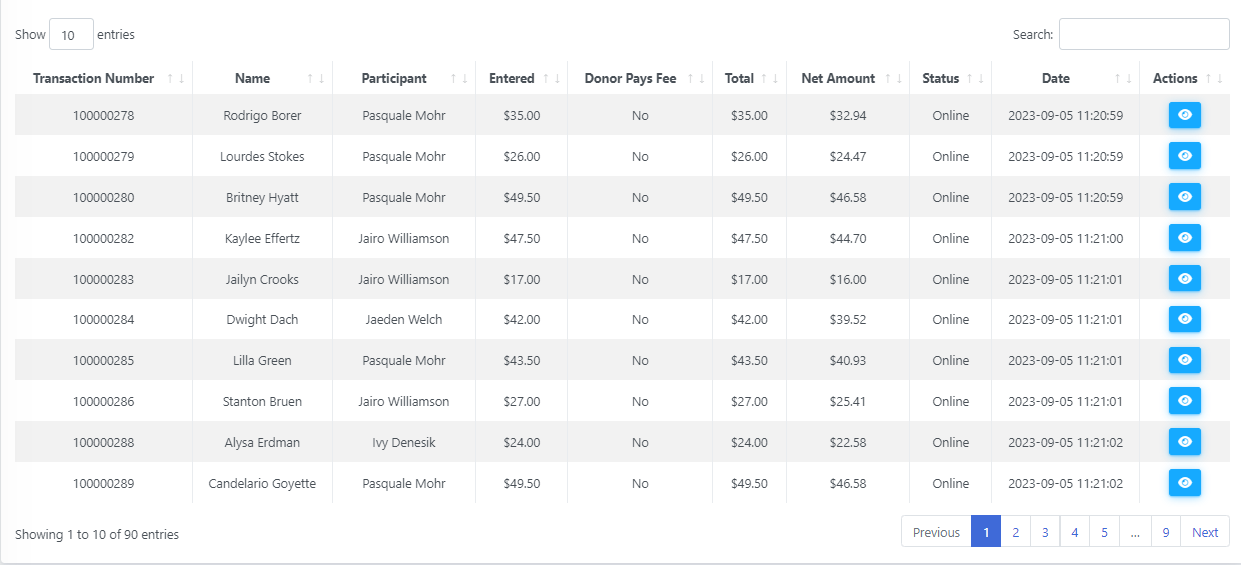
Participant Donations
This report gives you details about all the donations that have been made to the participants.
-
Initial sum of the donation amount.
corporate/myfunrun/help-center/dashboard.donsum2 -
Donor Paid Fee
Depending on the intial setup of your account, this is the sum added to the Donation amount that helps to pay for the MyFunRun fee. -
Total
Total sum charged on the donor's credit card.
Total = Donation + Donor Paid Fee< -
Net to Client
Net to Client = Total -MyFunRun Fee -
MyFunRun Fee
MFR Fee = 13% of the Donation amount - Donor Paid Fee> -
Details
For offline donations, this is where you can Edit, Approve or Un-approve donations.
For online donations, this is where you can see their Details. .
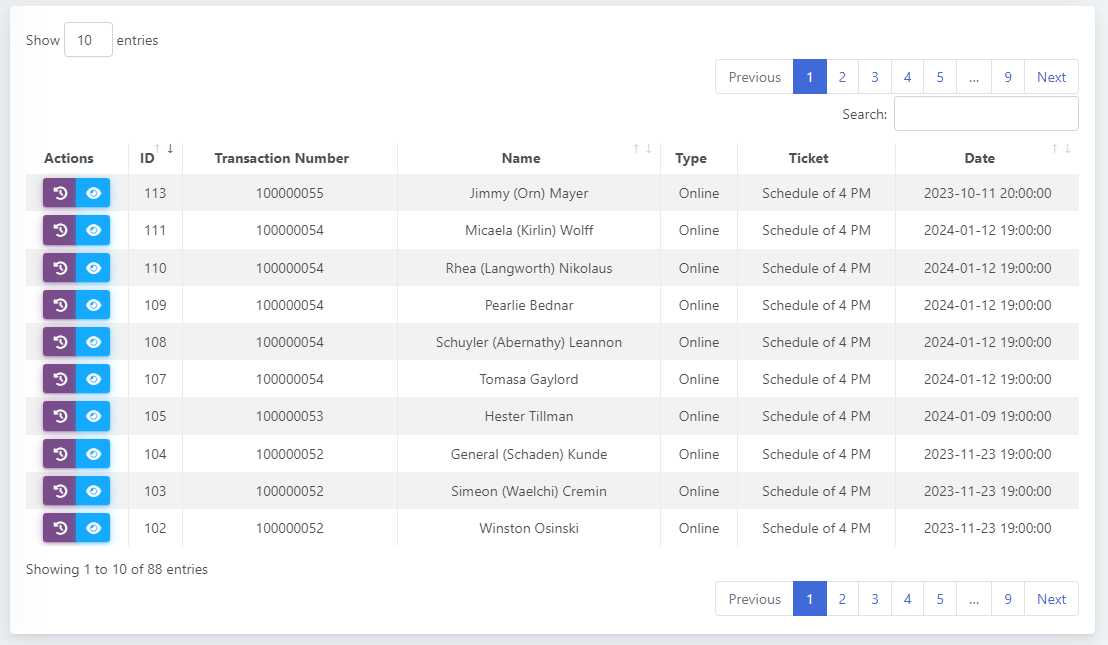
Ticket Report
This report gives you details on all the Registrations / Tickets bought. To better view all the additional data collected, we recommend to download the Event Registration Excel Report on top of the table.
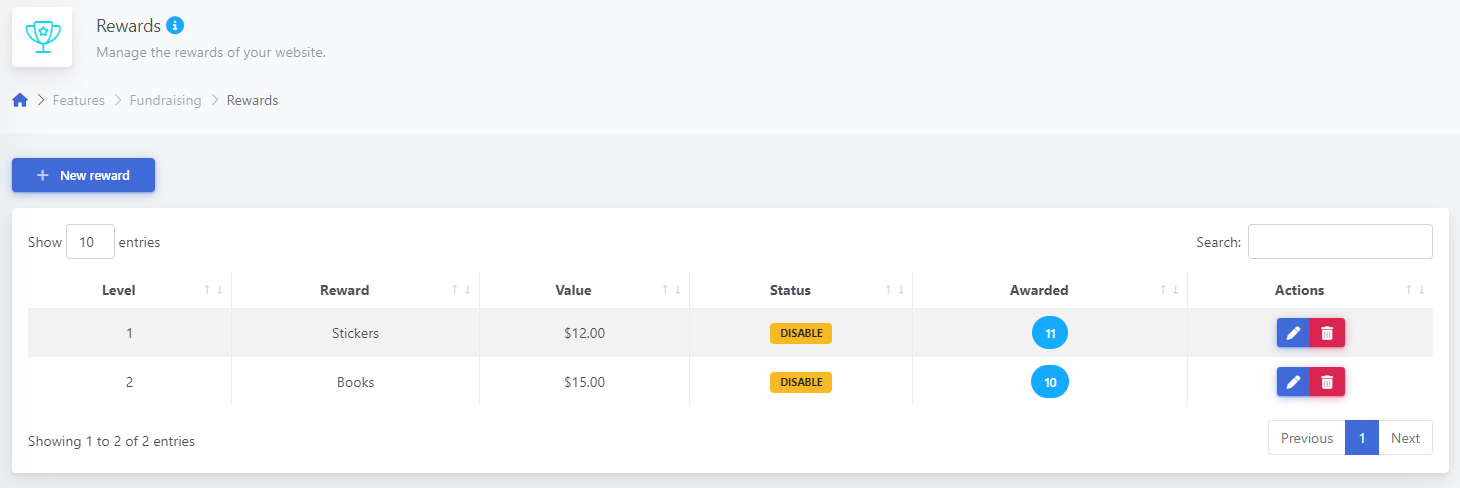
Rewards Report
The Rewards Report is designed to allow you to easily manage your rewards program.
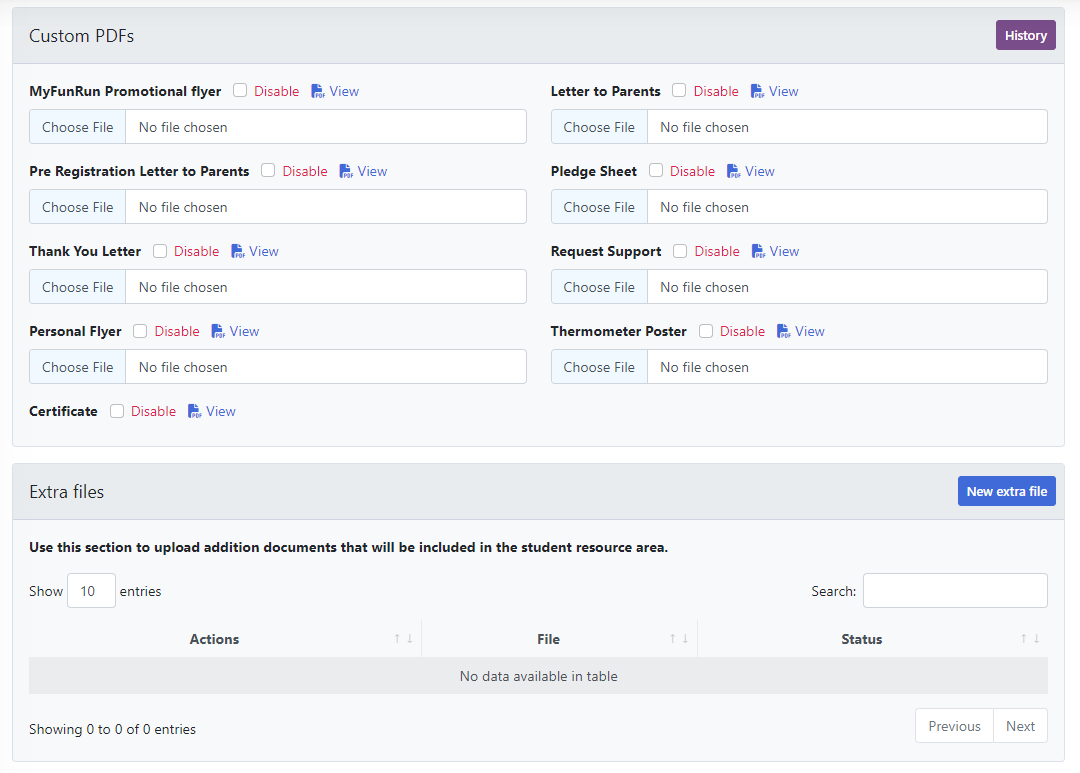
Resources
The Resources tab is where you can access all your customized campaign materials in one place.
-
Student Kits
Includes, letter home to parents, QR Flyer, healthy fundraising Flyer, Pledge sheet, sample letters, etc.. -
Miscellaneous materials
Guide Book, certificates of completion, posters. -
Promotion materials
Assembly guide, letters to parents, teachers checklist, FAQ, timelines and schedules, sample letters, sample press releases, etc...
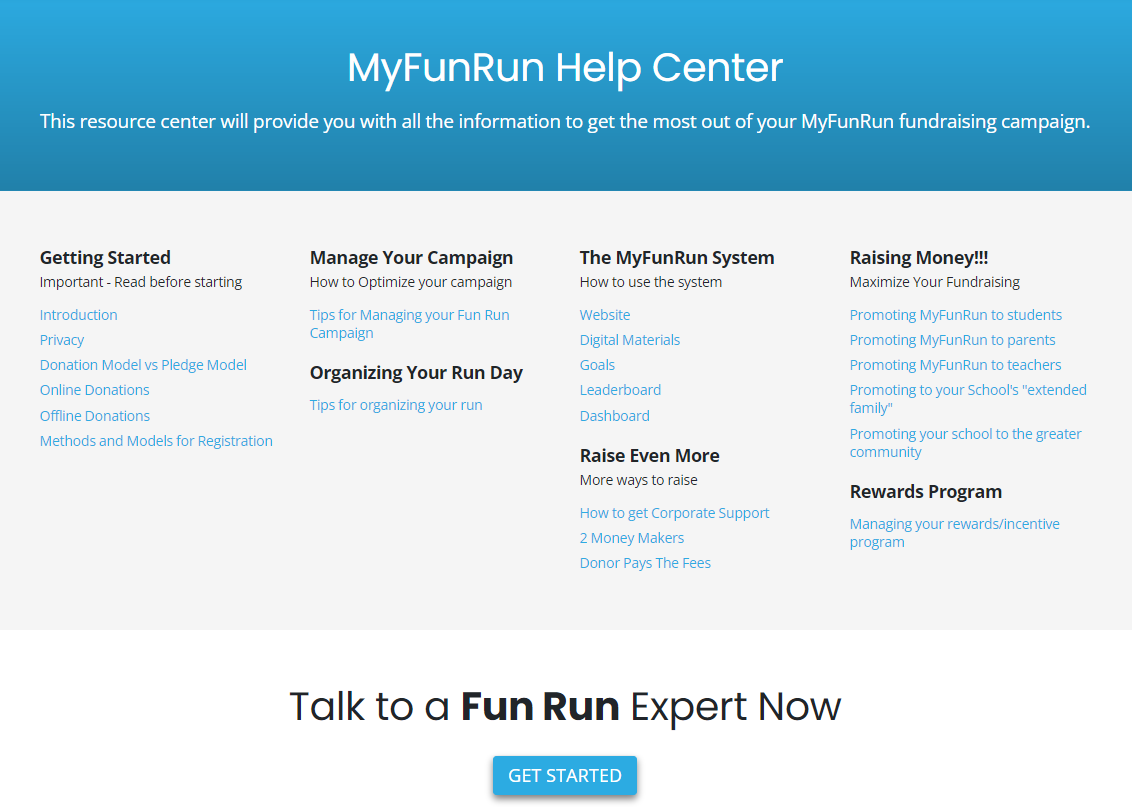
Talk to a Fun Run Expert Now
Need Help?
Please contact our support team toll free at 1.877.769.3836 ext: 230.